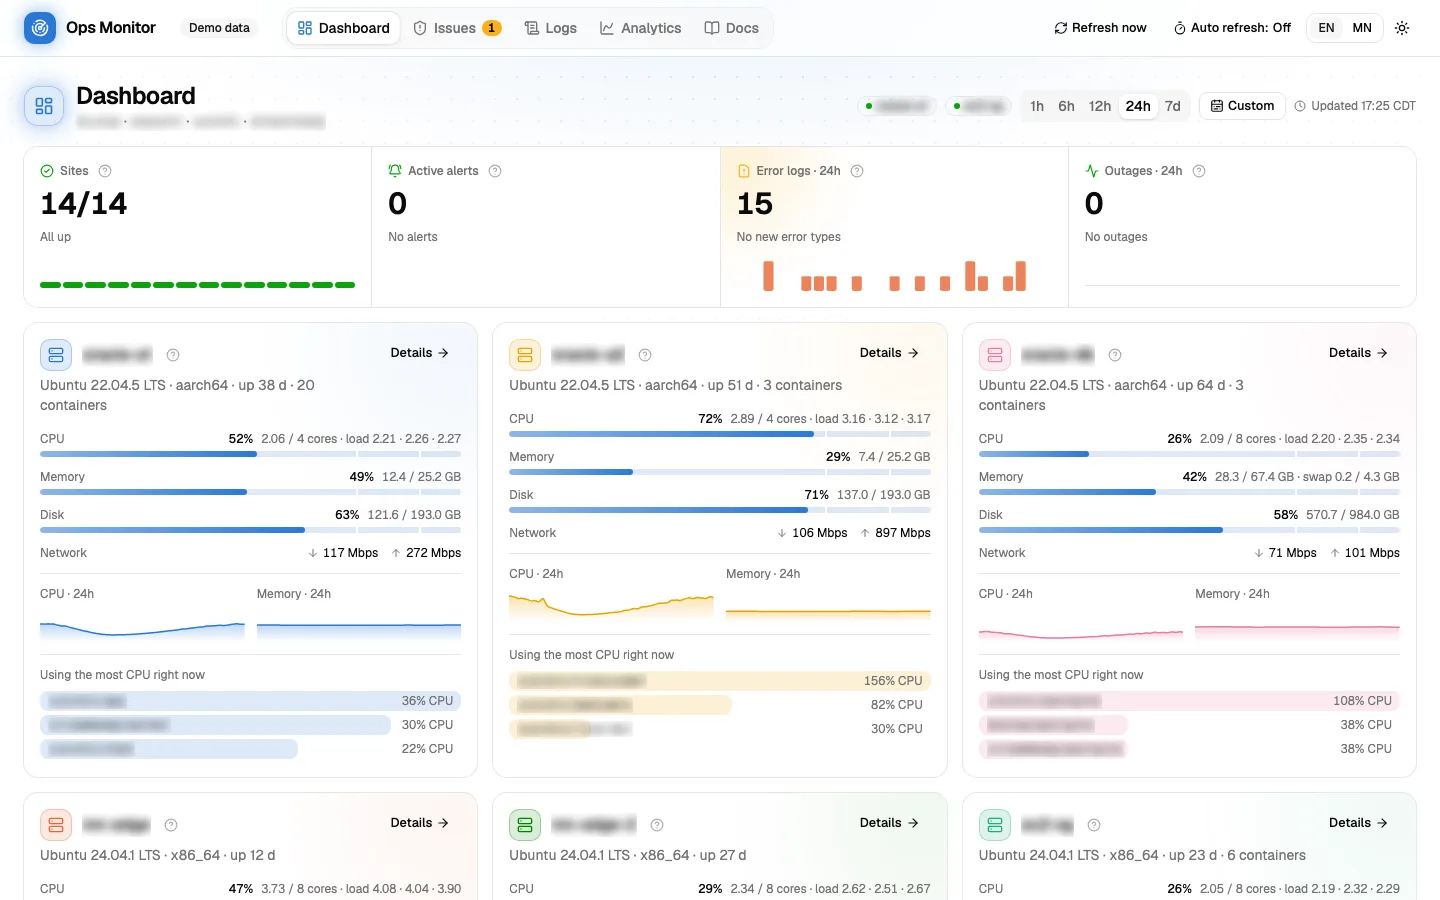
I operate four products on three servers. Three of them share one Oracle Cloud ARM host, the fourth runs on AWS EC2 in Singapore, and a cache node in Ulaanbaatar serves video to viewers in Mongolia. Before this project there were two separate Grafanas, no per-container metrics or logs on the shared Oracle host, and nothing reading the edge node’s host metrics.
Centralized Monitoring puts one board over all of it. The data stays where it is: each server keeps its own Prometheus, Loki and Alertmanager, and a small web app on Vercel reads every server on demand. It answers the questions I actually ask during an incident: what is down, who is using the CPU and since when, which errors are new, and what is about to break.
It is a personal project, designed and built end to end over one weekend in September 2026, and it has run in production since. The board sits behind a password, so the screenshots show its built-in demo mode, which runs the same code on invented data, with names and log contents blurred.
1. Why not just Grafana
Both obvious options were already on the table, and I turned both down.
Not Grafana Cloud
Two Prometheus stacks already held the data. Moving it to a hosted service would have been a migration that answered no question the servers could not already answer.
Not another dashboard
What I wanted were answers, not graphs: which container peaked and when, which error patterns are new this week, what needs action now. PromQL returns the peak of a series but not the moment it happened, and none of these questions fits in one panel spread across two Grafanas. Over the query results, each is a few lines of code. So the existing Grafanas stayed, with a new job: they are the gateway the board reads through, and the place to go for a deep dive.
2. Architecture
Collection stays on each server; reading happens in one place. The diagram traces both paths and the alerting path, which deliberately does not go through the board.
Component responsibilities
- Collection — every server runs its own Prometheus, Loki and Alertmanager. Nothing is shipped off the box; the board asks when someone looks.
- Gateway — each server’s existing Grafana, reached through its datasource proxy with a Viewer-role token. No port was opened on any server for the board.
- Outside checks — Better Stack watches the public sites from outside every server. When a box dies together with its own monitoring, the board still shows its sites going down.
- Board API — Vercel Functions in Singapore. They query every server in parallel with a 30-second cache, add Better Stack’s checks and Google Analytics, and shape the results into answers.
- Board — a React single-page app, installable as a PWA, in English and Mongolian. One shared password in front of the pages and the API.
- Alerting — Alertmanager pages Telegram directly. The board never sends an alert, so it can be down without taking paging with it.
Interactive — pan, trace a path, switch theme, or open the guided views
Open full size3. Filling in the data layer
The EC2 server already had a full stack, which I had built for it in August. The Oracle host only watched one of its three products, so most of the work was there.
- Per-container metrics — cAdvisor, so a CPU spike has a name, not just a host.
- Logs — Loki with Grafana Alloy, labelling every line by project, service and level. Nginx request counts become metrics on the way.
- Host network — a second node exporter reading /proc/1/net/dev, because a containerised exporter only sees its own container’s network.
- Probes — blackbox checks each site’s public endpoints every 30 seconds, plus an internal readiness endpoint that checks Postgres and Redis.
- Backups — a heartbeat metric for a backup script to write after each successful dump. After 26 hours without one, the board warns.
- Shared labels — host, project, service and level mean the same thing on every server, so one query shape works everywhere.
The cutover kept the old Compose project name, so bringing the new stack up adopted the running containers and kept fifteen days of metrics and every Grafana user and token.
4. What the board answers
Each page exists to answer one question. Nothing is stored: every view is computed when it is opened, from Prometheus and Loki plus Better Stack and GA4, and every filter lives in the URL, so any view is a shareable link.
One rule set, one list
The Issues page runs one rule set over everything the board already loaded: a source it cannot reach; sites that are down, whether the server’s own probe says so or Better Stack sees it from outside; sites that are slow or flapping; firing alerts; CPU, memory and disk; a disk forecast to fill within two weeks; expiring certificates; stale backups; restart loops; failed scrape targets; bursts of failed logins; and error patterns that are new this week. Each issue says what is wrong, shows the evidence and links to the page that explains it.
How a log line becomes a pattern
Numbers, UUIDs, IP addresses, hex strings and short quoted values are replaced with placeholders, and an HTTP line groups by its route rather than its path, so a thousand channel slugs are one pattern instead of a thousand. A pattern counts as new when it did not occur in the previous seven days.
The logs page
Every project’s errors and warnings, for any span up to 30 days back, sit on one page. It filters by project, service and level, searches the text, and can show only new patterns. A histogram splits the span by level, and each pattern expands into its latest lines; the same lines can also be read one by one. A JSON line is laid out field by field, what happened and why first: msg, status, route, reason, error. The LogQL behind the page is printed on it, so every count can be checked against the raw query.
| Page | The question it answers |
|---|---|
| Dashboard | Is everything healthy, what peaked, who caused it and when? |
| Issues | What needs action right now: what is wrong, the evidence, and what to do next |
| Logs | Which errors are new, how often each one happens, and when it started |
| Server | Where one host’s CPU, memory, disk and network go, down to each container |
| Analytics | Who is on each site right now, and how that compares with the span before (GA4) |
5. Getting the numbers right
A monitoring view that rounds away an outage is worse than none, because it is trusted. The logic behind these rules sits in one module with no I/O and 22 unit tests.
- Probe resolution — probes run every 30 seconds, so a chart step takes the worst probe in it: min_over_time for outages, max_over_time for latency. A 40-second outage cannot fall between two points.
- Availability — failed probes over all probes, not a ratio of whichever points a chart happened to sample.
- Log buckets — a Loki count at time t covers the bucket that ends at t. The histogram aligns to that and fills empty buckets with zeros, so each bar means what its label says.
- Stable labels — labels changed while the system was being built, so history is grouped by instance and host, which stayed the same.
6. Security
- Tokens stay server-side — the Grafana tokens have the Viewer role, and every token (Grafana, Better Stack, Google) lives only in the Vercel Functions. The browser never sees one.
- No query injection — user filters reach LogQL only as validated label values or a regex-escaped search string.
- Least privilege — the Postgres exporter logs in with a role that can read database statistics and no application table.
- Small public surface — only the PWA install files are served without the password, and none of them holds anything private.